What Is Match Momentum in Football?
Expected read time: 8 min
Match momentum shows which team is creating the greater attacking threat at different stages of a football match. Instead of looking only at the score or total possession, it visualizes how control and pressure shift minute by minute.
Table of contents
The short answer
Match momentum is a live interpretation of how a match is developing. A team can lead 1–0 while spending most of the second half under pressure, or have 65% possession without creating meaningful danger. A momentum graph adds context by showing which team is producing the stronger attacking phases.
What does match momentum measure?
Match momentum measures the changing level of attacking threat and control throughout a football match. There is no single official formula, so the exact calculation can differ between platforms. Models commonly combine signals such as:
- Attacking actions and movement into dangerous areas
- Dangerous attacks, counterattacks and penalty-area entries
- Shots, shots on target, corners and set-piece pressure
- Recent match events and where actions occur on the pitch
- Yellow cards, red cards and other changes to the match state
- How recently each action happened
Recent events normally carry more weight than events from much earlier in the match. If one team dominated from the 20th to the 30th minute but its opponent then wins several corners, repeatedly enters the penalty area and forces two saves, the momentum graph should begin moving towards the opponent.
What does a match momentum graph show?
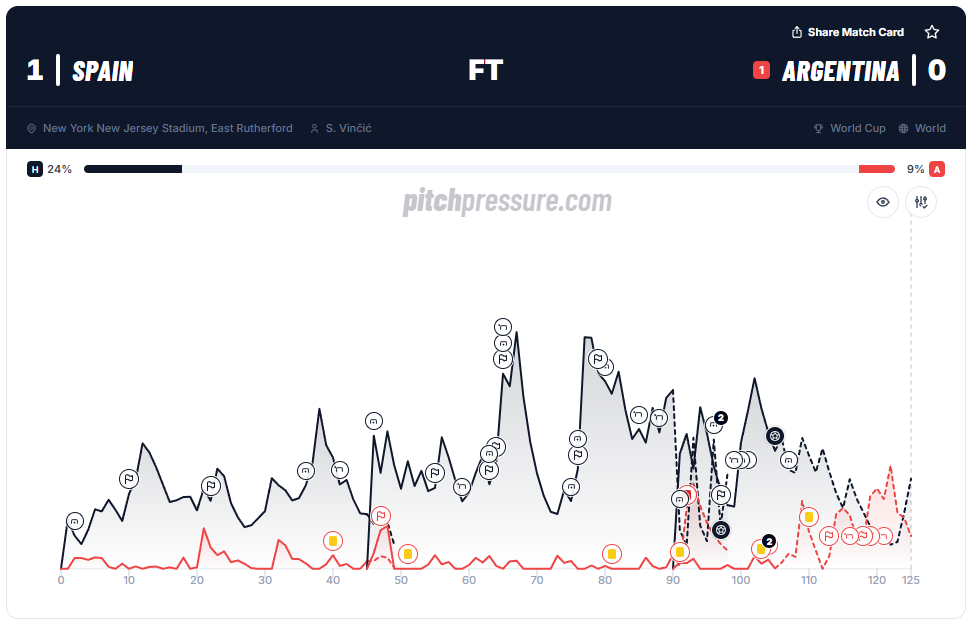
A match momentum graph plots attacking pressure against match time. On PitchPressure, both teams have a momentum percentage between 0% and 100%, with a baseline at the bottom. The higher the percentage, the higher that team’s line appears on the vertical axis. The horizontal axis follows the match minute.
A small isolated peak
A brief attacking moment rather than sustained control.
Several peaks for one team
Repeated pressure and a potentially important attacking phase.
A long elevated section
Sustained momentum over several minutes.
The leading line changes
Momentum has shifted from one team to the other.
A goal against the graph
The goal may have arrived against the run of play.
Example: an away team grows into the second half
Harju Jalgpallikool won this match 5–2, but the final score does not describe every phase. After half-time, Paide’s red momentum line rises above the home line for a sustained spell. The away side creates several attacking moments and turns that pressure into a goal. This is a useful reminder that momentum describes a period of the match, not necessarily the team that will win.
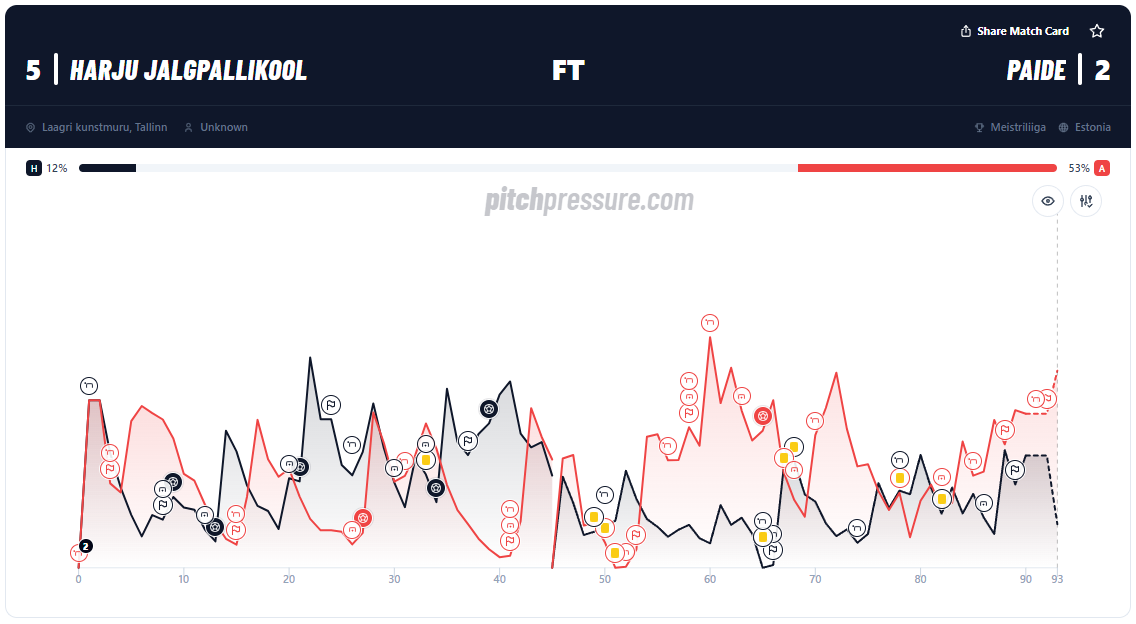
Some platforms use bars, waves or filled areas instead of lines. The purpose is the same: to make the changing flow of the game easier to understand. For a practical walkthrough, read how to read live momentum graphs.
Match momentum is not the same as possession
Possession tells you how long each team had the ball. It does not automatically tell you what the team did with it. A side can circulate the ball between defenders and midfielders without reaching dangerous areas, while an opponent creates quick counterattacks and shots with less of the ball.
Match momentum tries to separate harmless possession from threatening play. This is why the team with the most possession does not always have the strongest momentum.
Match momentum is not the same as xG
Expected goals, usually shortened to xG, estimates the quality of scoring chances after shots have been attempted. Match momentum covers a broader part of the game and can identify attacking pressure before an attack becomes a shot.
xG
How good were the shots a team took?
Match momentum
Which team created the greater threat and control during each phase?
A team may repeatedly enter the final third, win corners and create danger without completing a clear shot. Its xG can remain low while its momentum rises. The two metrics are most useful when read together rather than treated as competing statistics.
What creates a momentum shift?
Momentum shifts can happen gradually or suddenly. Common causes include:
Tactical changes
A manager may push the full-backs higher, add an attacker or change the pressing structure.
Goals
The scoring team may defend deeper while the team that conceded attacks with more urgency.
Substitutions
Fresh players can add pace, directness and energy to an attacking phase.
Red cards
A dismissal changes the available space, defensive structure and risk level for both teams.
Missed chances
A major chance or saved penalty can lift one team and make the other more cautious.
Fatigue
As players tire, pressing becomes less coordinated and more space appears between the lines.
Important context
Does high momentum mean a goal is coming?
No. Strong momentum means one team is creating a stronger attacking phase, but poor finishing, blocked shots, saves, offsides, inaccurate final passes or a counterattack can prevent that pressure from becoming a goal. Treat momentum as context, not as a prediction.
How should you use match momentum?
Start by checking the match situation around the graph:
- 1What is the current score and match minute?
- 2Has either team received a red card?
- 3Is the pressure sustained or based on one isolated moment?
- 4Do shots, shots on target or corners confirm the pressure?
- 5Is the attacking team chasing the match or protecting a lead?
- 6How does the pressure compare with the teams’ usual goal timing?
The same pattern can mean different things in different situations. A losing favourite applying sustained pressure in the 70th minute is different from a team leading 3–0 creating one short attacking spell. Use PitchPressure event markers, pressure data and live statistics to understand how the full match is developing.
What match momentum cannot tell you
- ×That a goal will definitely be scored
- ×Which team will win the match
- ×Whether an attack will produce a high-quality chance
- ×Whether a team’s finishing is reliable
- ×Whether the current pressure can be maintained
- ×Whether a counterattacking team is comfortable defending deep
Momentum also cannot replace watching the match. It summarizes complex live activity into an accessible visual, but some tactical detail will always be lost. Read it alongside the score, match time, shots, dangerous attacks, corners, cards and pre-match context.
Frequently asked questions
What does match momentum mean in football?+
Match momentum describes which team is creating more attacking threat and control during a particular period of a match. It changes as the flow of the game moves between the two teams.
Is match momentum the same as possession?+
No. Possession measures time on the ball, while momentum attempts to measure the threat and intensity created during each phase.
Can both teams have momentum?+
Both teams can create dangerous phases, but a graph normally shows which team has the stronger momentum at a specific point in time.
Can match momentum predict a goal?+
Momentum can highlight increasing pressure, but it cannot guarantee or reliably predict that a goal will follow.
Final thoughts
Match momentum turns the flow of a football match into a visual timeline. It shows when pressure is building, when control changes sides and when the scoreline does not tell the full story. The strongest analysis combines momentum with recent shots, shots on target, corners, dangerous attacks, match time and the current score.
View live match momentum